Trying to decide whether to rent or buy in Westwood? When you run the numbers the right way, the answer gets clearer fast. If you are relocating to Greater Boston or eyeing your first luxury purchase, you want a disciplined, local model that reflects Westwood’s price points, tax rates, and jumbo-loan realities. In this guide, you’ll get a step-by-step framework, three example scenarios, and a worksheet outline so you can plug in your own data with confidence. Let’s dive in.
Start with the right local inputs
Before you compare rent and buy, gather a few Westwood-specific data points:
These inputs anchor your model to reality. Westwood’s strong commuter access and school district demand often influence both purchase prices and rent premiums, which can impact your breakeven timeline.
Assumptions used here
The following are example defaults to illustrate the math. Replace each item with live data for your situation.
- Mortgage term: 30-year fixed; show 15-year as a toggle.
- Example rate: 7.0% (illustrative only) from Freddie Mac PMMS range.
- Down payment: 20% baseline; show 10% and 5% with PMI as alternates.
- Property tax: 1.1% of value as a placeholder. Use the Westwood assessor’s actual rate.
- Homeowners insurance: 0.25% to 0.5% of value annually.
- Maintenance reserve: 1.0% of value for typical single-family; 1.5% to 3.0% for luxury or older homes.
- Closing costs (buy-side): 2% to 3% of price.
- Selling costs: commonly 5% to 6% of the sale price.
- Opportunity cost on down payment: 4% annually baseline.
- Appreciation scenarios: 0% to 2% conservative, 2% to 3% baseline, 4%+ aggressive.
- Rent growth: 2% to 4% annually.
- Tax considerations: Mortgage interest and property taxes may be deductible depending on itemizing and the $10,000 SALT cap. See IRS Publication 936 and consult a tax advisor.
The rent vs. buy math
Here is the framework your worksheet should follow.
Key inputs
- Purchase price (P), down payment (DP), loan amount (P − DP)
- Mortgage rate (annual r) and term (years)
- Property tax, insurance, HOA/condo fees
- Maintenance reserve (% of value)
- Utilities difference (owner vs. renter), renter’s insurance
- Closing costs to buy, selling costs at exit
- Appreciation rate, rent inflation, investment return on DP
- Holding period (years), tax effects
Core calculations
- Monthly mortgage principal and interest (P&I)
- monthly rate = r/12
- payment = Loan × [monthly rate / (1 − (1 + monthly rate)^−n)], where n = term × 12
- Monthly property tax = annual tax / 12
- Monthly insurance = annual insurance / 12
- Monthly maintenance = (maintenance % × P) / 12
- Total monthly ownership cost = P&I + tax + insurance + HOA + maintenance
- Adjusted owner cost (optional) = total ownership cost + opportunity cost of DP − estimated monthly tax benefit
- Equity buildup over time = cumulative principal paid + appreciation on owner’s equity share, net of selling costs
- Net owner cost over holding period = cumulative owner outflows − sale proceeds after selling costs and taxes + buy-side closing costs
- Renter cost over same period = rent × 12 × years + renter’s insurance + rent inflation; adjust for investing any saved down payment
- Comparative result = net owner cost − cumulative renter cost
- If negative, ownership is cheaper by that amount over the horizon. If positive, renting was cheaper.
Westwood case studies by price tier
Below are three illustrative scenarios using the default assumptions above. Replace with live rate, tax, and price data for your search.
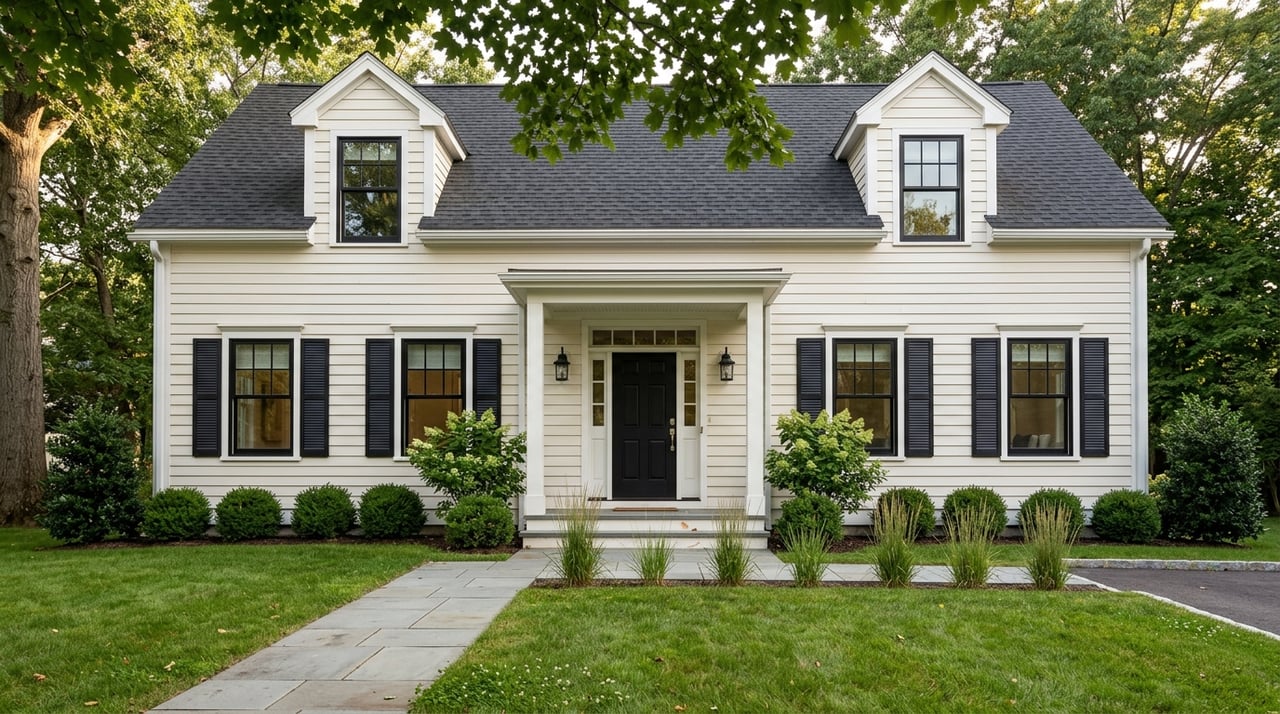
Entry single-family example: P = $700,000
- Down payment: $140,000; loan: $560,000
- P&I at 7.0% (30-year): ≈ $3,726 per month
- Property tax at 1.1%: $7,700 per year → $642 per month
- Insurance at 0.35%: $2,450 per year → $204 per month
- Maintenance at 1%: $7,000 per year → $583 per month
- Total monthly ownership cost: ≈ $5,155
- Opportunity cost of DP at 4%: ≈ $467 per month
- Effective economic cost: ≈ $5,622 per month
What it means: For comparable homes renting for less than this effective cost, renting could be cheaper in the near term. Ownership may pull ahead over a longer holding period once equity and appreciation are counted.
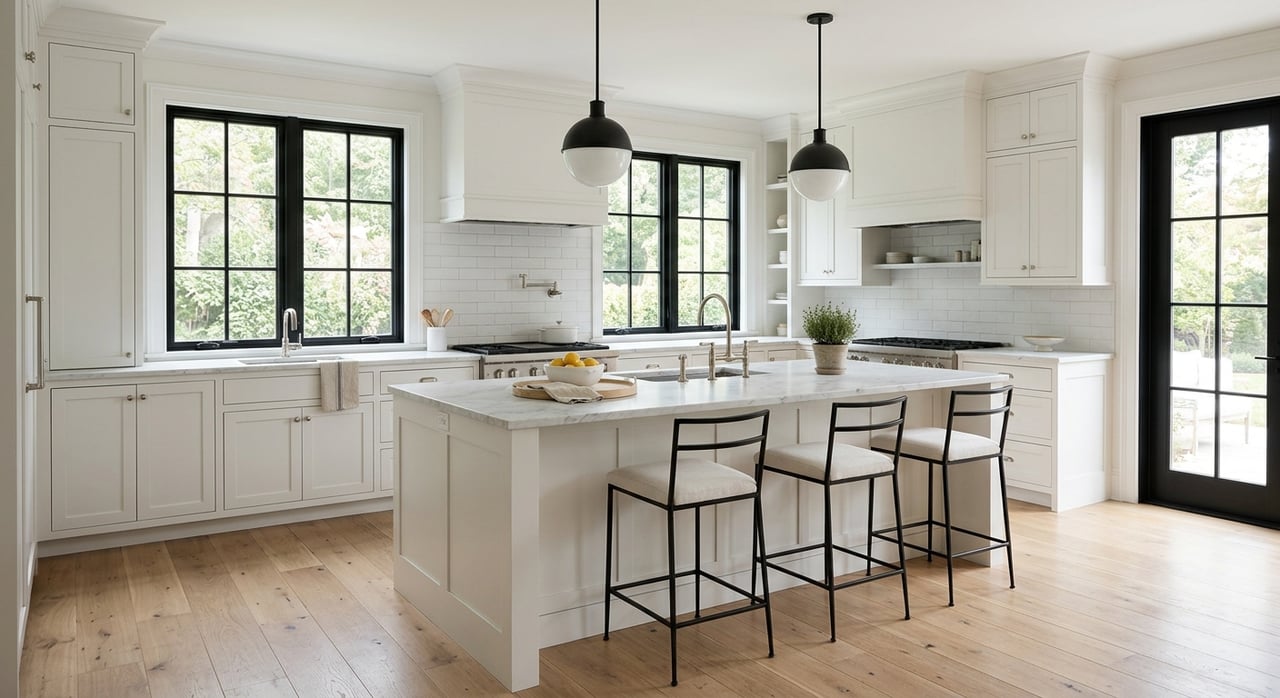
Upper-mid example: P = $1,500,000
- Down payment: $300,000; loan: $1,200,000
- P&I at 7.0%: ≈ $7,984 per month
- Property tax at 1.1%: $16,500 per year → $1,375 per month
- Insurance at 0.35%: $5,250 per year → $438 per month
- Maintenance at 1%: $15,000 per year → $1,250 per month
- Total monthly ownership cost: ≈ $11,047
- Opportunity cost of DP at 4%: ≈ $1,000 per month
- Effective economic cost: ≈ $12,047 per month
Key nuance: This price likely requires a jumbo loan in Norfolk County. Jumbo loans can require larger down payments and may carry different rates and reserve requirements. Confirm specifics with your lender and reference the FHFA loan limit map.
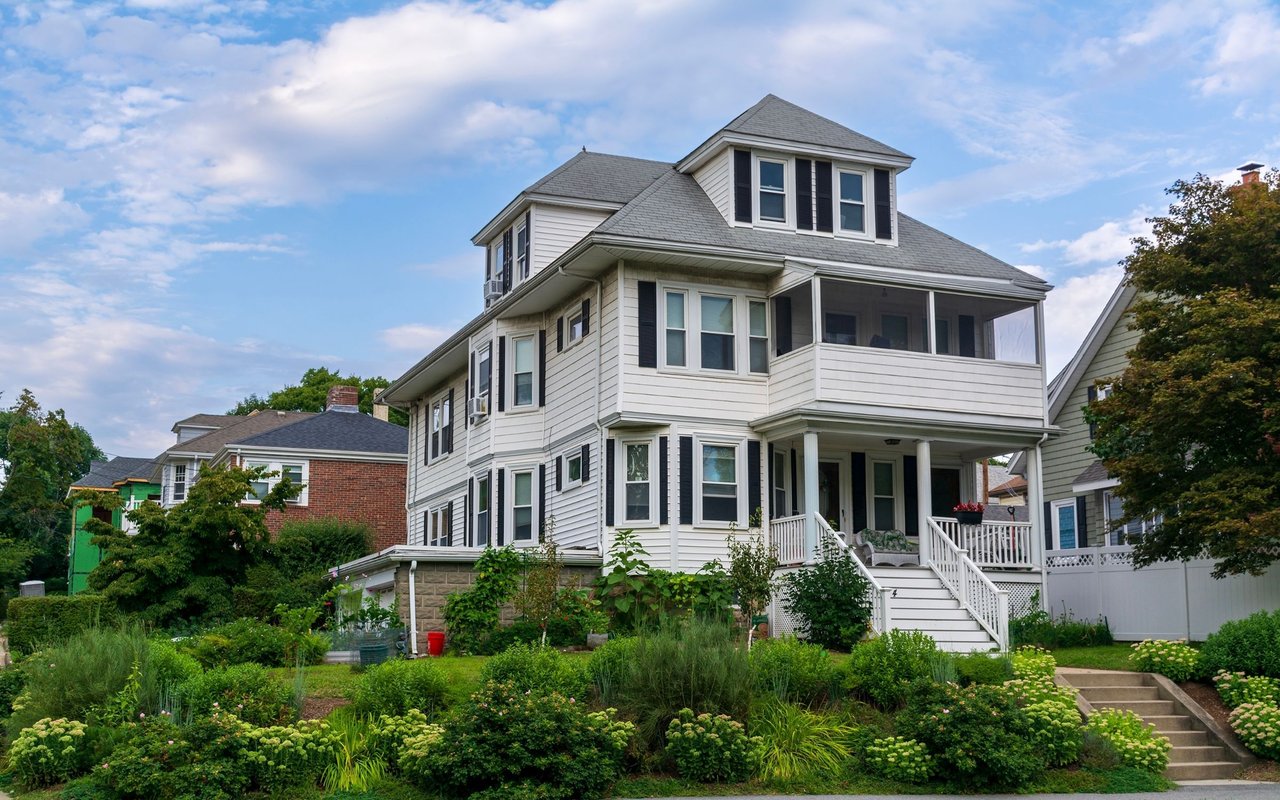
Luxury example: P = $3,000,000
- Down payment: $600,000; loan: $2,400,000
- P&I at 7.0%: ≈ $15,968 per month
- Property tax at 1.1%: $33,000 per year → $2,750 per month
- Insurance at 0.35%: $10,500 per year → $875 per month
- Maintenance at 1.5%: $45,000 per year → $3,750 per month
- Total monthly ownership cost: ≈ $23,343
- Opportunity cost of DP at 4%: ≈ $2,000 per month
- Effective economic cost: ≈ $25,343 per month
Luxury lens: At higher price points, maintenance, insurance, and property tax become major drivers of carrying cost. The opportunity cost of a large down payment is also meaningful unless you place a premium on ownership benefits or expect strong appreciation.
Note: These examples do not include one-time purchase closing costs, potential tax benefits, or the value of equity buildup and sale proceeds. A full model nets those items over your chosen holding period.
Breakeven and holding period
Your breakeven is the shortest holding period at which buying and later selling has the same total economic outcome as renting and investing the difference. In Westwood, where demand is steady, a longer holding period generally favors buying because equity amortization and potential appreciation compound over time. Shorter stays, especially under three to five years, often favor renting unless you secure below-market financing or pricing.
Test sensitivity on these levers:
- Mortgage rate: model ±1.0%
- Appreciation: model 0%, 2%, 3%, 4%+
- Maintenance: model ±0.5%
- Holding period: compare 3, 5, 7, 10, 15 years
Build your worksheet
Create a simple sheet with these input fields:
- Purchase price, down payment %, loan term, mortgage rate
- Property tax rate or dollar amount; insurance; HOA fees
- Maintenance % per year; utilities differences; renter’s insurance
- Closing costs to buy; selling costs at exit
- Current monthly rent; rent inflation
- Expected annual appreciation; investment return on down payment
- Holding period; marginal tax rate and SALT usage (optional)
Include calculation blocks for:
- Monthly P&I, tax, insurance, maintenance, HOA
- Total owner cash flow and opportunity cost of DP
- Cumulative owner outflow over the horizon
- Sale proceeds at exit = sale price minus selling costs and remaining loan balance
- Net owner cost vs. cumulative rent cost with rent inflation and invested savings
How to read the result:
- If net comparative cost is negative, buying was cheaper by that amount over the horizon.
- If positive, renting was cheaper by that amount.
Smart features to add:
- Price-tier presets for $700k, $1.5M, and $3M examples
- Jumbo flag when price exceeds the county’s conforming limit
- Sensitivity toggles for rate, appreciation, and maintenance
- A checklist prompt for local data: current mortgage quote, Westwood tax rate, HOA presence, flood zone, recent sales comps, rent comps
Guidance for transferees
- Time horizon: If your stay is uncertain or short, emphasize the breakeven math. Renting can preserve flexibility while you learn the area.
- Speed and liquidity: Renting is faster and requires less upfront cash. Compare relocation benefits and housing allowances to ownership costs.
- School logistics: If school stability is a priority, ownership can provide predictability, even if near-term costs run higher.
Guidance for first-time luxury buyers
- Jumbo financing: Expect larger down payments and possible reserve requirements. Rates can differ from conforming loans.
- Elevated maintenance: Plan for 1.5% to 3.0% of value annually, especially for specialty systems like pools, septic, and complex landscaping. Request detailed maintenance records during due diligence.
- Insurance and liability: Discuss umbrella coverage with your insurance advisor to align coverage with asset value.
- Tax planning: Evaluate itemized deductions and the SALT cap with a CPA. See IRS Publication 936 for general guidance.
Shared ownership factors
- PMI: With less than 20% down on conventional loans, add PMI to your monthly cost. Model when PMI can be removed under conventional rules.
- Capital replacements: Roofs, HVAC, water heaters, and driveways have expected life cycles. Increase your reserve for older homes.
- Local due diligence: Confirm flood risk on the FEMA map. Verify the town tax rate through the Westwood Assessor. Review any HOA documents and fees.
- Selling costs: Include likely agent commissions and closing costs. For context on market norms, see NAR research.
Westwood data checklist
Next steps
If you are weighing rent versus buy in Westwood, a clear, local model beats rules of thumb. Gather the inputs above, run the scenarios that match your price point, and pressure-test your breakeven. If you would like a confidential, numbers-first review tailored to your goals and time horizon, schedule a free consultation with Theresa David.
FAQs
How long to stay for buying to pay off in Westwood?
- It depends on price, mortgage rate, taxes, maintenance, and appreciation. Test 3, 5, 7, and 10-year horizons. Longer stays increase the odds ownership outperforms renting, but high rates or low appreciation can change the outcome.
How much should I budget for maintenance on a Westwood home?
- A common rule is 1% of home value per year for typical single-family homes. Increase to 1.5% to 3% for luxury properties or older homes with specialty systems.
What are the hidden costs of owning in Westwood?
- Property taxes, insurance, major capital replacements like roof and HVAC, possible HOA assessments, and the opportunity cost of a large down payment.
Is renting always cheaper when mortgage rates are high?
- Not always. High rates raise P&I, but strong appreciation or high rent growth can still tilt the long-term math toward buying. Model sensitivities to see the turning points.
How do I factor tax benefits into a rent vs. buy model?
- Estimate deductible mortgage interest and property tax after considering itemizing versus the standard deduction and the $10,000 SALT cap. See IRS Publication 936 and consult a tax advisor for specifics.